Generating Presentable C-graphs
In practice complex networks can be difficult to display in terms of the CellDesigner format. For this reason, it is
usually simpler to present networks in terms of C-graphs. Although CRNT4SBML provides the functions
crnt4sbml.CRNT.plot_c_graph() and crnt4sbml.CRNT.plot_save_c_graph() to plot and save
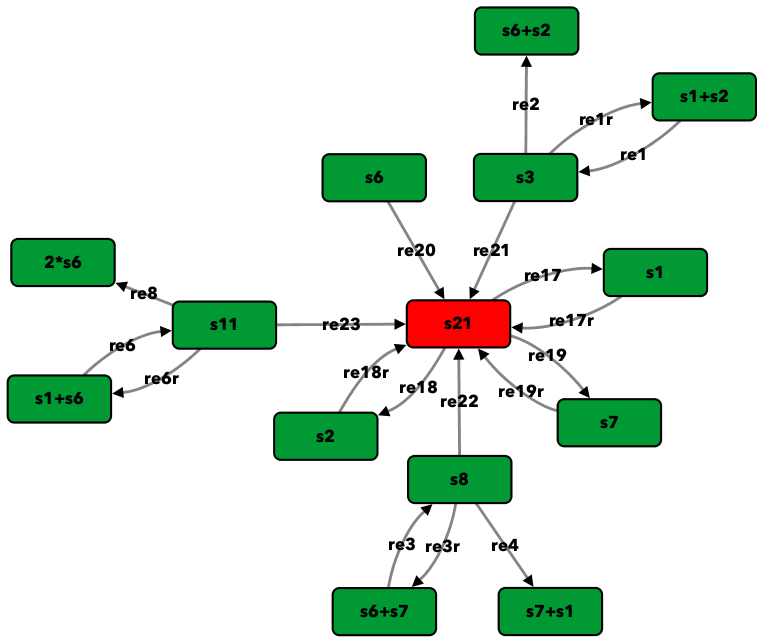
C-graphs using Matplotlib, respectively, for large networks these displays can be cluttered. For example, consider the
following semi-diffusive network:
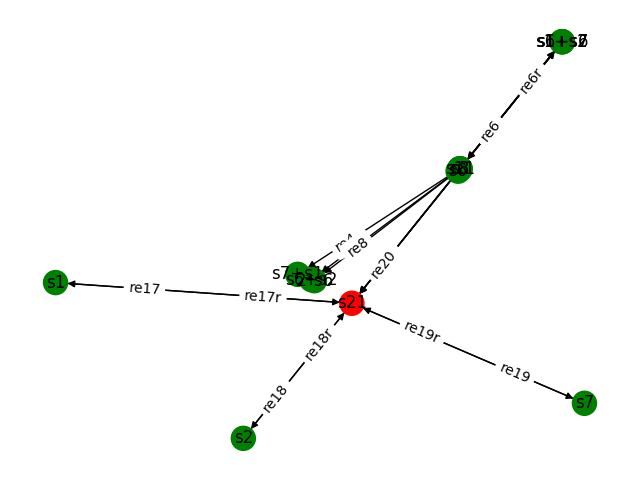
As mentioned in the NetorkX documentation ,
the graph visualization tools provided are not up to par with other graph visualization tools. For this reason, we suggest
using the cross-platform and easily installable tool Cytoscape to create presentable C-graphs.
Cytoscape allows one to import a network defined in the GraphML format which it can then use to create a C-graph.
To create a GraphML format of the provided network, CRNT4SBML contains the function crnt4sbml.CRNT.get_network_graphml().
Note that this function only extracts the nodes, edges, and edge labels. Below
we use use Fig1Cii.xml
to demonstrate turning a network into a GraphML file.
import crnt4sbml

c = crnt4sbml.CRNT("path/to/Fig1Cii.xml")

c.get_network_graphml()
This will provide a GraphML file for the Fig1Cii network in the current directory under the name network.graphml. We may
then use this file within Cytoscape by opening up the application and navigating to the menu bar selecting File -> Import ->
Network from File… then selecting network.graphml from the appropriate directory. We can then import the
CRNT4SBML Cytoscape Style by navigating to the menu bar selecting File ->
Import -> Styles from File … then selecting crnt4sbml_cytoscape_style.xml from the appropriate directory. Once the style
has been imported, we can use this style by selecting “Style” in the Control Panel and selecting “CRNT4SBML Style” in
the Current Style drop down box. Using the CRNT4SBML Style leads to the following C-graph.